Related Entries
Quick Start: Git for personal use
SVN client over SSH to remote Unix server from Windows
Quick Start Grinder - Part IV
Quick Start Grinder - Part III
Quick Start Grinder - Part II
« Quick Start Grinder - Part IV
» Austerity?
Quick Start Grinder - Part V
After a run, you will need to analyze your data. Grinder console gives real time graphs, but I find getting the results into an Excel/OpenOffice spreadsheet and then going over it much easier. After your runs, look into the log directory for files named out*.log. These are CSV files that can be imported into any spreadsheet program easily. I’ve attached a template below into which you can paste the raw data and see the results. Note that I consider only 100 rows - very unrealistic since you will have thousands of records! I did this so that the file size is small. You can change the formulas where it says row 100 to row whatever you want. Also note that some formulas are array formulas - they are surrounded by curly braces - you need to press CTRL-SHIFT-ENTER after updating such formulae.
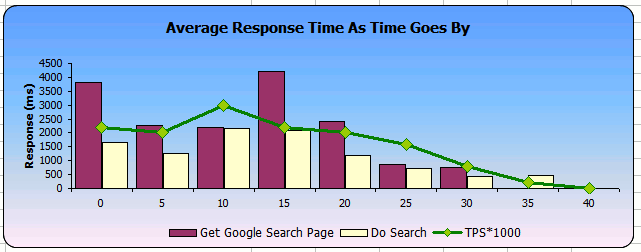
The above graph shows how much was the average response time for each test in 5 second slots. It also shows how many tests were run per second.
GrinderAnalyzer is another free tool that does pretty much the same thing. One thing I found missing in that is to see side-by-side comparison of the response times from different tests.
Sample Checklist before you start the tests
Since in reality, you won’t be testing Google, you should come up with a checklist against your own application before you run the tests. Few things I can think of are below.
- Are the application servers and database servers isolated? ie., No other applications are running?
- Are all the background processes relevant to your application started?
- Have you ensured you’ve utilities to monitor CPU utilization, RAM utilization etc are turned on in application and database servers?
- Do you’ve enough hard disk space to write application logs on the server and also for database growth?
- Have you taken a DB backup?
- How long are you planning to run the tests? Take a look at Grinder Properties - there are enough ones to control how long should the tests run, how many iterations etc. to control this.
- Double check your scripts so that you are simulating real life loads (unless you want to purposefully break the system to know the limitations) by inducing sleep in between.
- Are the JVM settings correct in your Grinder machine? If not, Grinder will crash much faster than your web application!
- Have you informed IT about expected high volumes on the network or the servers?
programming
