Weekwise Anomaly Visualization
Update May 28, 2020 - code using this is added to my covid 19 tracker repo with actual output
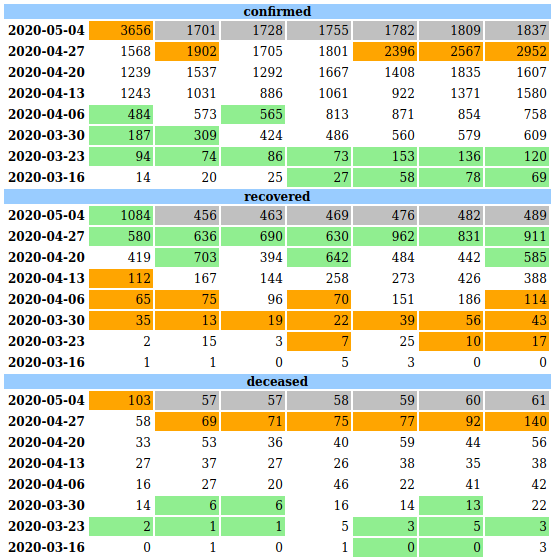
I find looking at daily numbers folded by week (ie. Mon to Sun in one row) for last 8 weeks a good way to look at the data. Especially if multiple tables are put one below the other for the same period, it is easy to identify patterns. Sample tables in a typical e-Commerce system could be orders, shipments, payment_failures etc.
Instead of looking at this manually, why not use ML to automatically highlight anomalies? I tried various things with hand coded models first, then ARIMA and finally settled on FBProphet library.
Read below to see how a simple system can be built with publicly available data. Bonus - if you have
not used jq and xsv, you can see how cool those are too.
Sample Data
covid19india is a crowd sourced website that shows a lot of visualizations about the state of COVID-19 in India. They've nicely available JSON APIs that gives the data by day.
curl with -z will download the data if the server has newer data.
curl -o data.json -z data.json https://api.covid19india.org/data.json
The data has multiple lists. The one we need is right at the top.
  "cases_time_series": [
    {
      "dailyconfirmed": "1",
      "dailydeceased": "0",
      "dailyrecovered": "0",
      "date": "30 January ",
      "totalconfirmed": "1",
      "totaldeceased": "0",
      "totalrecovered": "0"
    },...
JSON to CSV
Pretty much all data science stuff starts with CSV. Using jq, we can just extract the date and the 3 daily metrics to a csv.
  echo "dt,confirmed,recovered,deceased" > daily.csv
  jq -r ".cases_time_series[]|[.date, .dailyconfirmed, .dailyrecovered, .dailydeceased]|@csv" data.json \
       |sed -e 's/"//g' -e  's/^\(..\) \(.*\) \(.*\)/\1-\2-2020\3/g' >> daily.csv
- First
echois a cheap way to add header to a new daily.csv file. jqis a bit more complex. -r is to get raw output and the filter following it is to get the case_time_series child as an array or arrays with only four keys we need; and then the whole thing is given to @csv which simply converts an array to csv.sedremoves double quotes first and then makes the input date format from *01 January * to 01-January-2020. Not exactly safe for turn of the year, but that is how current json data is given.
Extract Specific Timeseries
The data I am interested in processing has only two columns, viz., date and value. So, if I need to get daily numbers of confirmed cases from this csv, multiple options are available:
- use
cut -f1-2 -d,to get first two columns - load data into a
sqlite3database and extract what I need - write another python+pandas script to load to a df, make another df with what I need and write to csv.
All will work. But an amazing tool exists for this xsv.
xsv select dt,confirmed daily.csv
That's it. Very easy. Admittedly, this data is very small - but xsv is extremely fast when your data file
is very large with lot of columns and lot of rows. It is worth investing to know what all options this
brilliant utility has.
Makefile - integration!
GNU Make is brilliant for such things. Here is my Makefile.
all:  data.json dashboard.html

dashboard.html : daily.csv
	./csv2dashboard.sh

daily.csv : data.json
	echo "dt,confirmed,recovered,deceased" > daily.csv
	jq -r ".cases_time_series[]|[.date, .dailyconfirmed, .dailyrecovered, .dailydeceased]|@csv" data.json \
      |sed -e 's/"//g' -e  's/^\(..\) \(.*\) \(.*\)/\1-\2-2020\3/g' >> daily.csv

data.json :
	curl -o data.json -z data.json https://api.covid19india.org/data.json

clean :
	rm -f *.html *.csv

.PHONY : data.json
Just run make all and open dashboard.html in a browser. That's it.
Oh wait, what is there in this csv2dashboard.sh?
csv2dashboard.sh - combined html
This is just a wrapper script to call the main python one multiple times.
#!/bin/bash
NUMWEEKS=8
startdt=`date -d"monday-${NUMWEEKS} weeks" +%Y%m%d`
OUTPUT_FILE="dashboard.html"
rm -f o.html
for CATEGORY in confirmed recovered deceased; do
  #https://github.com/BurntSushi/xsv
  if [ "$CATEGORY" == "recovered" ]; then
    #we should highlight recoveries over anomaly as green
    COLOR_ARGS="-p lightgreen -n orange"
  else
    COLOR_ARGS="-n lightgreen -p orange"
  fi
  #make the csv with two columns and don't print the header
  xsv select dt,$CATEGORY daily.csv | tail -n +2  \
     | python3 weeklies.py -s $startdt -k $NUMWEEKS -o ${CATEGORY}.html -t "%d-%B-%Y" $COLOR_ARGS
  #cleanup the html generated to remove time component, nan etc; and add a header to the table
  cat ${CATEGORY}.html|sed  \
     -e 's/ 00:00:00//g' \
     -e 's/<table /<table border="0" cellspacing="2" cellpadding="2" /g' \
     -e "s/<thead>/<caption style='font-weight:bold;background-color:#99ccff;'>${CATEGORY}<\/caption><thead>/g" \
     -e 's/<td /<td width="60" align="right" /g' \
     -e 's/<tr> *<th class="index_name level0" >.*<\/tr>//g' \
     -e 's/nan//g' \
     -e 's/<thead>.*<\/thead>//g' >> o.html
  rm -f ${CATEGORY}.html
done
mv o.html $OUTPUT_FILE
# this is a bad html; so force an exit code of 0
tidy -m $OUTPUT_FILE || exit 0
Before you ask why do I need startwk and number_of_weeks, I plan to use the python script for not just last 8 weeks, but out of turn dates too.
weeklies.py - pandas & fbprophet
The real meat is in this file, weeklies.py.
Instead of keeping it here, I've added to a public gist.
Some examples that you might find useful in that code outside of fbprophet are below.
- argparser module to easily handle command line arguments
- Find nth Monday before this week
today - datetime.timedelta(days=today.weekday(), weeks = n) - Make a date range in pandas
dates = pd.date_range(start_date, periods=((days)) - Adding a mask to a dataframe for some columns, based on values in other columns
- Apply html style and hide columns to render a dataframe.
Final Setup
- Get a modern bash shell with GNU utilities
- Install python3
- Install pandas and numpy
- Install fbprophet
- Install jq, xsv and tidy
- Add a
Makefileas per the content above - Add a
csv2dashboard.shfrom above.chmod +x csv2dashboard.shto make it executable. - Get
weeklies.pyfrom the gist above. - Run
make all
Gotchas
- Without changing source data, I get different anomaly detections at different runs some times. Could be some seed issue that I've missed. I have not looked into how fbprophet actually implements their algorithms.
- Weekly folding has a bug in that it doesn't consider current day's data, if it is run on a Monday.